The Number of Faculty Members in Physics Departments
The number of faculty members working in physics departments is steadily increasing over time. The percentage of temporary and non-tenure-track faculty positions in physics departments differs by the highest physics degree offered at an institution.
The Overall Number of Full-Time Equivalent Faculty Members Increases
In the academic year of 2017-2018, the 761 departments that granted physics degrees employed about 10,100 full-time equivalent (FTE)[1] faculty members. Although the overall number of departments that grant physics degrees has been stable since 2012, the number of FTE faculty members in these departments has increased over time (Table 1).
Table 1

The overall estimated number of FTE faculty members in physics departments has increased to 10,100 in 2018 from 9,400 in 2012. When comparing physics departments by highest degree awarded, the number of FTE faculty members increased between 2012 and 2018 for PhD-granting departments and departments that only award bachelor’s degrees. The total number of FTE faculty members for departments where the highest degree awarded is a master’s has remained stable over time.
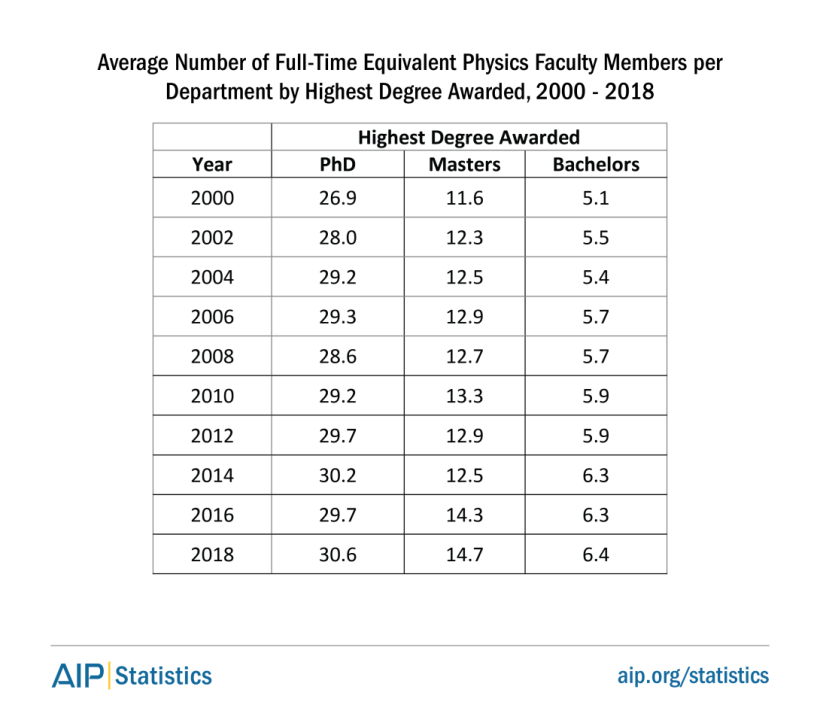
Since 2000, there has also been an increase in the average number of FTE physics faculty members across all types of physics departments. The largest absolute increase in average FTE faculty members between 2000 and 2018 occurred in PhD-granting departments with an overall gain of 3.7 FTE (Table 2). Departments where a master’s degree is the highest degree awarded had an overall average gain of 2.9 FTE, and departments that only award bachelor’s degrees had the smallest overall average gain of 1.3 FTE since 2000.
Table 2

We also examined the compounded annual growth rate of FTE faculty members at different types of physics departments. Both departments awarding a bachelor’s or master’s as their highest degree had the same compounded annual growth rate in FTE faculty members, which was 1.3% between 2000 and 2018. For PhD-granting departments, the compounded annual growth rate in FTE faculty members was slightly lower at 0.7% between 2000 and 2018.
The Proportion of Temporary and Non-Tenure Track Faculty Remains Steady
Overall, 21% of physics FTE faculty members were employed in temporary or non-tenure-track permanent positions in 2018 (Figure 1), and the overall proportion of FTE faculty members in these positions has increased from 14% in 2000. When comparing types of physics departments, the proportion of FTE faculty members in temporary or non-tenure-track positions was substantially higher for departments that only award bachelor’s degrees (26%) and those where a master’s degree is the highest degree awarded (25%) than for PhD-granting departments (17%).
We also examined growth rates for the average number of physics FTE temporary and non-tenure-track permanent faculty members over the last 18 years, and all types of physics departments showed similar growth. The compounded annual growth rate for temporary and non-tenure-track FTE faculty members in PhD-granting departments was 3.2% between 2000 and 2018. For those where a master’s degree is the highest degree awarded, the compounded annual growth rate was 3.6%; and, for departments that only award bachelor’s degrees, it was 3.1%.
Figure 1

Bachelor’s Degree Production Was Influenced by Highest Degree Awarded
We found that the type of physics department has an impact on the number of physics bachelor’s degrees produced each year. This is likely due to the number of FTE faculty members employed at different types of physics departments. Although PhD-granting physics departments were only 26% of all bachelor’s degree-granting institutions in 2018, they awarded 54% of all the physics bachelor’s degrees received during the same year. PhD-granting departments also employed 61% of all FTE faculty members in 2018, and employing more faculty members enables a physics department to teach more courses and graduate a greater number of students.
It is also important to examine the number of physics bachelor’s degrees produced per FTE faculty member in physics departments (Figure 2). While PhD-granting departments produced a larger total number of physics bachelor’s degrees, the departments that only award bachelor’s degrees produced more physics bachelor’s degrees per FTE, which was a median of 1.0 bachelor’s degrees per FTE. PhD-granting departments produced a median of 0.6 bachelor’s degrees per FTE, and departments where a master’s degree is the highest degree awarded produced a median of 0.7 bachelor’s degrees.
Figure 2

Survey Methodology
This Focus On series uses data from the 2018 Academic Workforce Survey. The Academic Workforce Survey has been conducted every two years since 1986. Between March and June 2018, we contacted 797 physics and astronomy departments (including 39 astronomy-only departments) that award a bachelor’s degree in physics or astronomy. We sent follow-up messages to those departments that had not responded. We received responses from 720 institutions, a 90% response rate. For non-responding departments, we estimated the number of faculty members using outside sources where possible. These estimates were added to the survey data. Outside sources were not available for all departments, so the sum of the estimates and the survey data was divided by the response rate for our final estimate.
Acknowledgements
We offer our sincere gratitude to the responding departments. Without your help, we could not track these data or provide them to the community.
e-Updates
You can sign up to receive e-mail alerts that notify you when we post a new report or resource. Visit www.aip.org/statistics/e_updates
Follow Us on Twitter
The Statistical Research Center is your source for data on education, careers, and diversity in physics, astronomy, and other physical sciences. Follow us at @AIPStatistics.
The Number of Physics Faculty Members in Academic Departments
By Cynthia Helba, Anne Marie Porter, Starr Nicholson, and Rachel Ivie
Published: January 2020
A product of the Statistical Research Center of the American Institute of Physics
1 Physics Ellipse, College Park, MD 20740
stats [at] aip.org | 301.209.3070 | aip.org/statistics
Footnotes
[1] Full-time equivalent (FTE) is an indicator of faculty workload in departments. A value of 1.0 FTE represents a full-time workload for a single faculty member. A single part-time faculty member would be represented with an FTE value of less than 1.0.


