Women in Physics and Astronomy, 2019
This report provides a comprehensive overview of the representation and participation of women in physics and astronomy fields. The report describes the representation of women in high school physics enrollment, physics and astronomy degree completions, and faculty employment. In addition, it examines the representation of minority women at some of these levels. The report also examines potential gender differences in salary, job satisfaction, career opportunities, career resources, and family influences on career outcomes. Finally, it identifies points of attrition for women in physics and astronomy between postsecondary education and faculty employment.
Highlights
- In 2017, women earned 21% of physics bachelors’ degrees and 20% of physics doctorates. In that same year, women earned 33% of astronomy bachelors’ degrees and 40% of astronomy doctorates.
- In recent years (2007–2017), the percentage of women earning a bachelor’s degree in physics and astronomy has not changed over time. However, the percentage of women enrolling in physics graduate programs and earning a physics doctorate has continued to rise.
- In 2017, there were 21 physics departments at four-year institutions that awarded 40% or more of their bachelors’ degrees to women, and 21 physics departments that awarded 30% or more of their doctorates to women. There were 13 women’s colleges offering a physics bachelors’ degree program in 2017.
- In 2013, 46% of high school physics students were young women, and this percentage has remained stable since 2003. In addition, 37% of high school teachers were women, and this percentage has grown over time.
- In 2014, 16% of physics faculty members and 19% of astronomy faculty members were women. In 2016, 26% of newly hired physics faculty members and 40% of newly hired astronomy faculty members were women. The percentage of faculty members who are women is increasing over time.
- In 2014, women occupied only 10% of full professor positions, but this is due to women earning fewer doctoral degrees in the past. When comparing the percentage of women employed as professors with past doctorate completions, there were as many women in full professor positions as expected, and more women in assistant and associate positions than expected.
- African-American and Hispanic women remain under-represented in physics and astronomy. However, the number of Hispanic women earning physics and astronomy degrees is growing rapidly over time, while the number of African-American women has not shown similar growth.
- Gender differences in salary emerge mid-career. For recent physics graduates, there were no gender differences in salary one year after graduation; however, men had 10% higher salaries than women 10–15 years after graduating with a physics doctorate.
- Compared to men, women reported that their careers progress more slowly and that they received fewer career resources and opportunities. In addition, women were more likely to make career compromises for family reasons.
The authors wish to thank our colleagues from the Statistical Research Center at the American Institute of Physics for assisting with the analyses in this report: Starr Nicholson, Patrick Mulvey, Jack Pold, John Tyler, and Susan White.
Introduction
The participation of women in physics has greatly increased since the 1920s (Figure 1); however, the proportion of women among physics students and faculty members is still below that of other disciplines. Women earn over 50% of all bachelor’s degrees (National Center for Education Statistics, 2016), but women earn only 21% of physics and 33% of astronomy bachelors’ degrees.
Figure 1

This report will provide a comprehensive overview of the representation and participation of women in physics and astronomy fields. This report has three main goals:
- To describe the representation of women in high school physics enrollment, physics and astronomy degree completions, and faculty employment. Data are graphically displayed over many years, but the emphasis in our discussion is placed on changes in the most recent decade. In addition, we will examine the representation of minority women at these levels.
- To compare employment outcomes for men and women with physics and astronomy degrees by exploring potential gender differences in salary, job satisfaction, career opportunities, career resources, and family influences.
- To identify points of attrition for women in physics and astronomy between postsecondary education and faculty employment. For example, we will examine the percentage of attrition at the faculty member level based on women’s past doctorate degree production.
In this report, we used physics and astronomy data collected by the Statistical Research Center at the American Institute of Physics. We obtained data on students from the Enrollments and Degrees Survey and data on faculty members from the Academic Workforce Survey and the Faculty Member Survey. Data on other academic fields were obtained from the Integrated Postsecondary Education Data System (National Center for Education Statistics [NCES], 2016), and the Survey of Earned Doctorates (National Science Foundation [NSF], 2016).
Students and Degrees
High school students. In 2013, we estimate that 1.38 million students were enrolled in high school physics courses. While the number of young women enrolled in high school physics courses has grown, so has the number of young men. Thus, the percentage of young women in physics courses has remained stable around 46% since 1997 (Figure 2; White and Tesfaye, 2014).
Figure 2

During high school, many young women participated in Advanced Placement (AP) physics programs. The AP Program offered four physics exams in 2017: Physics 1, Physics 2, Physics C: Mechanics, and Physics C: Electricity and Magnetism. Physics 1 and 2 are algebra-based courses, and Physics C courses are calculus-based. Figure 3 shows the number and percentage of young women who participated in the four AP physics exams. Around 160,000 students participated in Physics 1 exams, and 40% of test-takers were young women (The College Board, 2017). Around 90,000 students participated in the other three exams, and between 24-28% of Physics 2 and Physics C test-takers were young women. Although the representation of young women among Physics 1 exam-takers was higher than the other exams, the percentage earning a “passing” score (3 or higher) was lower (Figure 4). 30% of young women passed the Physics 1 exam, compared to 48% of young men. However, in the other exams, there was a smaller difference between the percentage of young women and young men who passed the exams.
Figure 3

Figure 4

Bachelor’s degrees. Women remain under-represented among physics bachelor’s degree recipients. According to our 2017 Enrollments and Degrees Survey, over 8,500 students were awarded bachelor’s degrees in physics, and 21% of degrees were earned by women. Although the number of women earning physics bachelor’s degrees has steadily increased over the last decade (Figure 5), the percentage of women has not increased (Figure 6). Since the percentage of women has shown little change between 2007–2017, bachelor’s degree completion is increasing at similar rates for men and women.
Figure 5

Figure 6

The representation of women in astronomy is higher than in physics. In 2017, over 500 astronomy undergraduates were awarded bachelor’s degrees, and 33% of these degrees were earned by women (Figure 7). While the number of women earning astronomy degrees has steadily increased between 2007–2017 (Figure 8), the number of men earning degrees has shown greater increases. Therefore, the total percentage of women earning astronomy bachelor’s degrees has decreased in recent years (33% in 2017 compared to 40% in 2007).
Figure 7

Figure 8

Doctoral programs and degrees. The percentage of women earning physics doctorates and enrolling in doctoral programs has increased in recent years. In 2017, over 1,800 doctorates were awarded in physics (Figure 9) and 20% of these were earned by women (compared to 18% in 2007; Figure 6). Among first-year physics graduate students, 22% were women (compared to 18% in 2007; Figure 10).
Figure 9

Figure 10
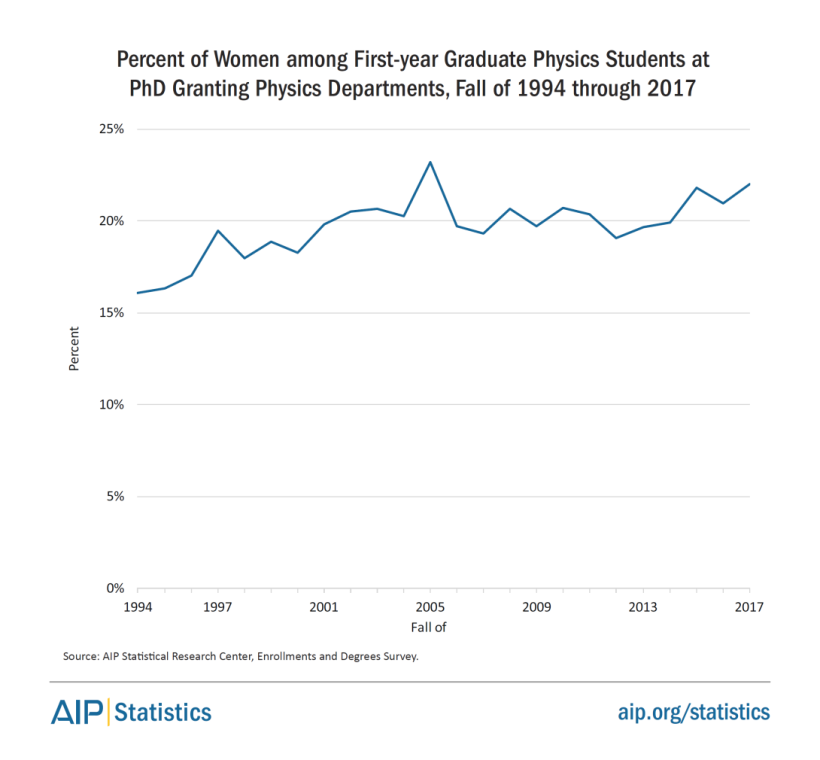
As with bachelor’s degrees, the representation of women earning astronomy doctoral degrees and enrolling in graduate school was higher than in physics, and the percentage of women in astronomy at the doctoral level has increased in recent years. In 2017, 186 astronomy doctorates were awarded (Figure 11), and women earned 40% of doctoral degrees (compared to 28% in 2007; Figure 8). Women were also 40% of first-year astronomy graduate students (compared to 36% in 2007; Figure 12).
Figure 11

Figure 12

STEM field comparisons. Women are under-represented in physics and astronomy, but this is not true for all fields in STEM (Science, Technology, Engineering, and Math). Figures 13 and 14 show the percentage of women who earned bachelor’s and doctoral degrees across STEM fields between 1984 and 2016. At both degree levels, biological science and chemistry have the highest percentage of women, while physics, computer science, and engineering fields have the lowest (NCES, 2016; NSF, 2016). Astronomy has a higher percentage than physics, but still has a lower percentage compared to biological science, chemistry, and, at the bachelor’s level, mathematics. Overall, this demonstrates a gap in women’s representation between physics, astronomy, and many other STEM fields, and this gap has not changed in recent years.
Figure 14

Physics departments. Some physics departments in the United States award more physics degrees to women than others. Table 1 lists the 21 physics departments at four-year institutions that awarded 40% or more of their bachelor’s degrees to women between 2013 and 2017. These departments were mostly located at small private colleges, liberal arts colleges, or Historically Black Colleges and Universities (HBCUs). Table 2 lists the 21 physics departments at four-year institutions that awarded 30% or more of their doctoral degrees to women between 2013 and 2017. These departments were mostly located at large public universities. To be included on either list, physics departments must have awarded at least 5 bachelor’s or doctorate degrees to women between 2013–2017 and must have consistently provided data on gender and degree completions in the Enrollment and Degrees Survey. This survey has a response rate of over 90% each year.
Table 1
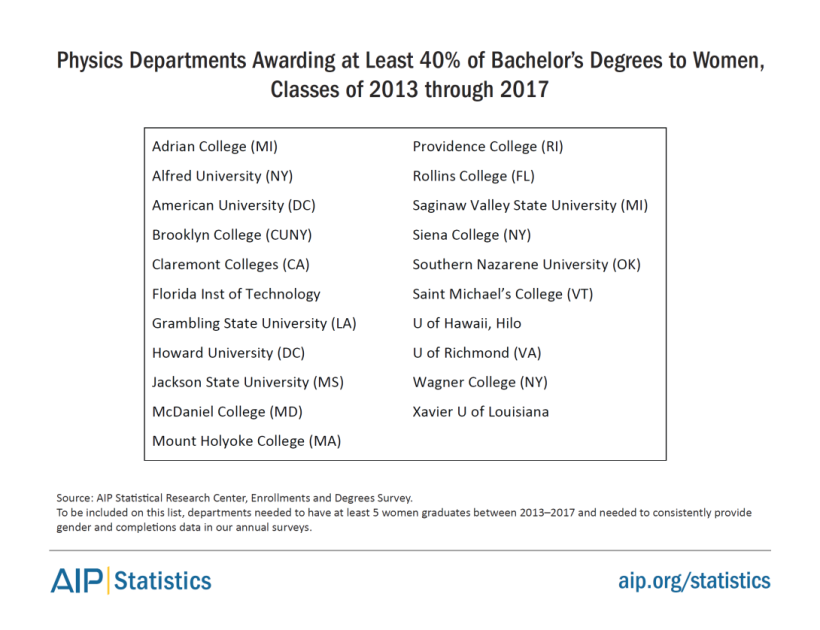
Table 2

Table 3 lists the 13 women’s colleges that awarded a physics bachelor’s degree or higher in 2017. Of all physics bachelor’s degrees awarded to women in 2017, 4% were awarded from women’s colleges.
Table 3

Teachers and Faculty Members
Although women continue to be under-represented among physics and astronomy teachers and faculty members, the number of women teaching physics at US high schools, universities, and colleges continues to grow over time. About 27,000 high school teachers taught at least one physics course in 2013 (White & Tesfaye, 2014), and about 37% of teachers were women (compared to 29% in 2001). The 2014 Academic Workforce Survey found that there were over 9,000 faculty members working in physics departments and 600 in astronomy departments. Overall, women were 16% of faculty members in physics departments (compared to 10% in 2002) and 19% of faculty members in astronomy departments (compared to 14% in 2003; Tables 4 and 5).
Academic rank. There is a steady increase in the percentage of women at different academic ranks in both physics and astronomy departments (Tables 4 and 5). In physics departments, more women were represented at adjunct and assistant ranks in 2014, and in astronomy departments, more women were represented at assistant and associate ranks. Although a smaller percentage of women were full professors in both fields, this is likely due to fewer women earning physics and astronomy doctorates in the past. It takes a number of years to transition from assistant to full professor status. Based on the percentage of women among assistant professors in 2014, we expect the percentage of women among full professors to increase over time as junior faculty gain experience and progress through the ranks. We take a closer look at these expectations in “The Pipeline” section of this report.
Table 4

Physics departments. The number and representation of women has increased across all physics departments between 2002 and 2014 (Table 6). When examining departments based on the highest physics degree granted in 2014, PhD departments had the lowest percentage of women, but had the largest number of women. Over 700 women were faculty members in PhD departments, and 14% of faculty members in these departments were women. Departments that offer a bachelor’s degree as the highest physics degree had the highest overall percentage of women. These departments employed over 600 women, and 20% of faculty members were women. There are very few departments in which a master’s is the highest degree granted, which explains why they have the least number of women. These departments employed over 100 women, and women represented 18% of faculty members.
Table 6

Ninety-five percent of departments that granted physics PhDs in 2014 employed women in full, associate, or assistant professor positions (Figure 15). Departments offering a bachelor’s or master’s as the highest physics degree were less likely to have women faculty members, probably due to smaller department sizes and fewer professorial positions compared to PhD departments (White and Ivie, 2013). Therefore, this data should not be taken as evidence that physics departments granting bachelor’s or master’s degrees are biased against women.
Figure 15
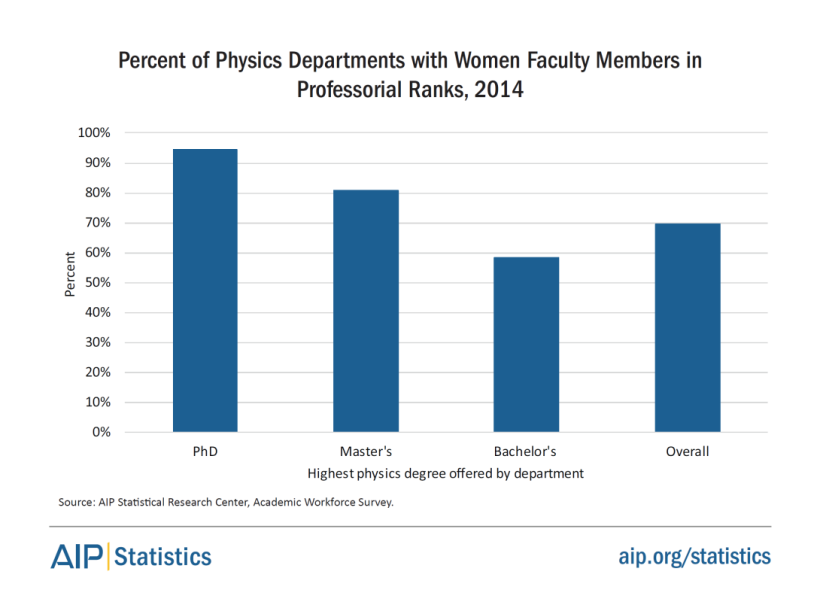
Figure 16 shows how the representation of women in PhD departments has progressed over time. In 2002, over 20% of PhD departments had no women in professorial ranks, but by 2014, this dropped to around 5%. Also, as of 2014, 14% of PhD departments had six or more women in professorial positions, which was very rare in 2002. Table 7 lists the PhD-granting departments with six or more women in professorial ranks. The list includes any departments that responded to the 2014 Academic Workforce survey and provided gender data (91% response rate).
Figure 16
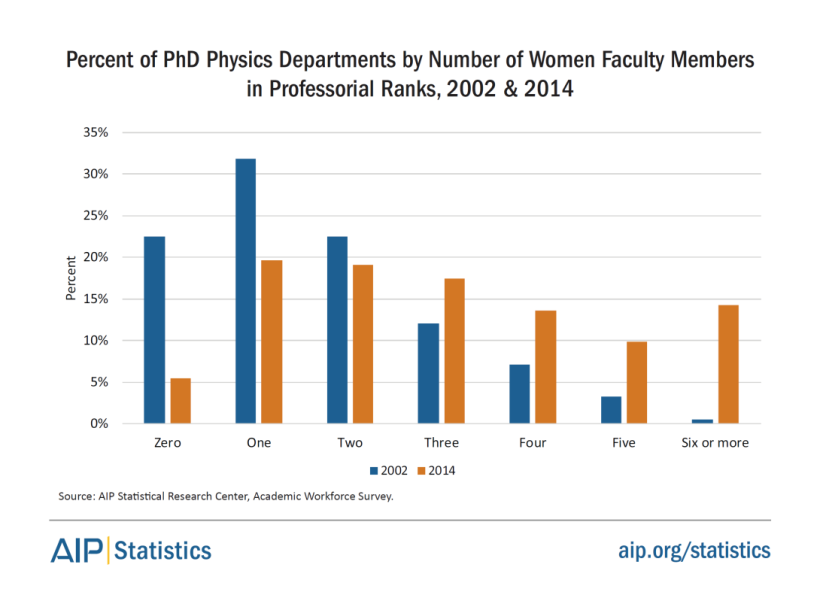
Table 7

Astronomy departments. There were 37 astronomy departments in 2014, and the overwhelming majority of them granted PhDs. Due to the small number of departments granting bachelor’s or master’s degrees as the highest astronomy degrees, we are unable to compare the representation of women in astronomy departments by highest degree granted.
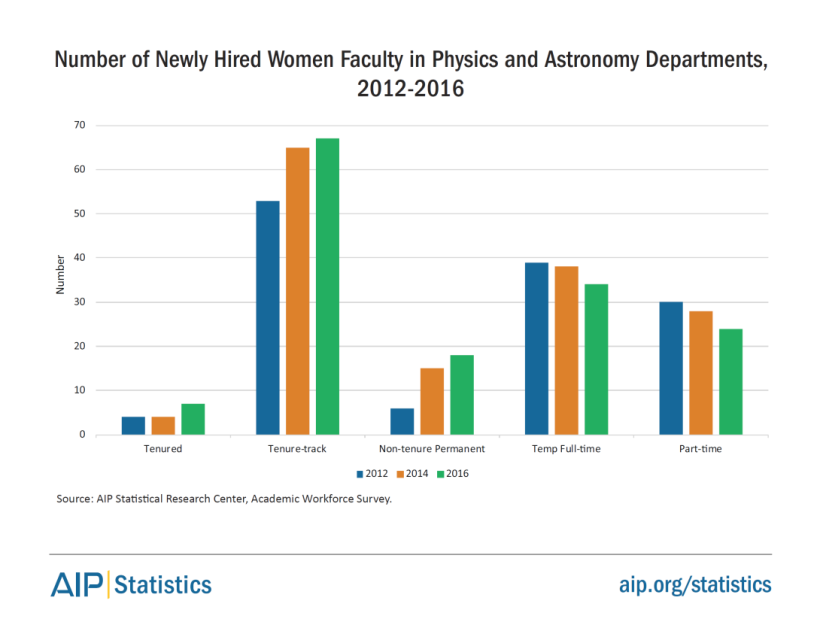
New faculty hires. In our 2016 Academic Workforce Survey, 567 new faculty members were hired in physics departments, and 26% of new hires were women. Astronomy departments hired 25 new faculty members, and 10 were women. For both fields, the greatest number of women were hired into tenure-track positions, and over time, the number of women hired into tenured, tenure-track, and permanent positions has increased (Figure 17). Although the greatest number of women are in tenure-track positions, the greatest percentage of women were in non-tenure-track positions. In 2016, women were hired into 32% of non-tenure-track permanent positions, 29% of temporary positions, 28% of part-time positions, and 23% of tenure-track positions.
Figure 17
Minority Women
Hispanic and African-American women remain under-represented in physics and astronomy. According to the most recent census data (United States Census Bureau, 2010), 13% of women in the United States are African-American and 16% of women are Hispanic. When we examined the percentage of minority women earning physics and astronomy degrees in 2016, the representation of African-American and Hispanic women was much lower than the general population of the United States.
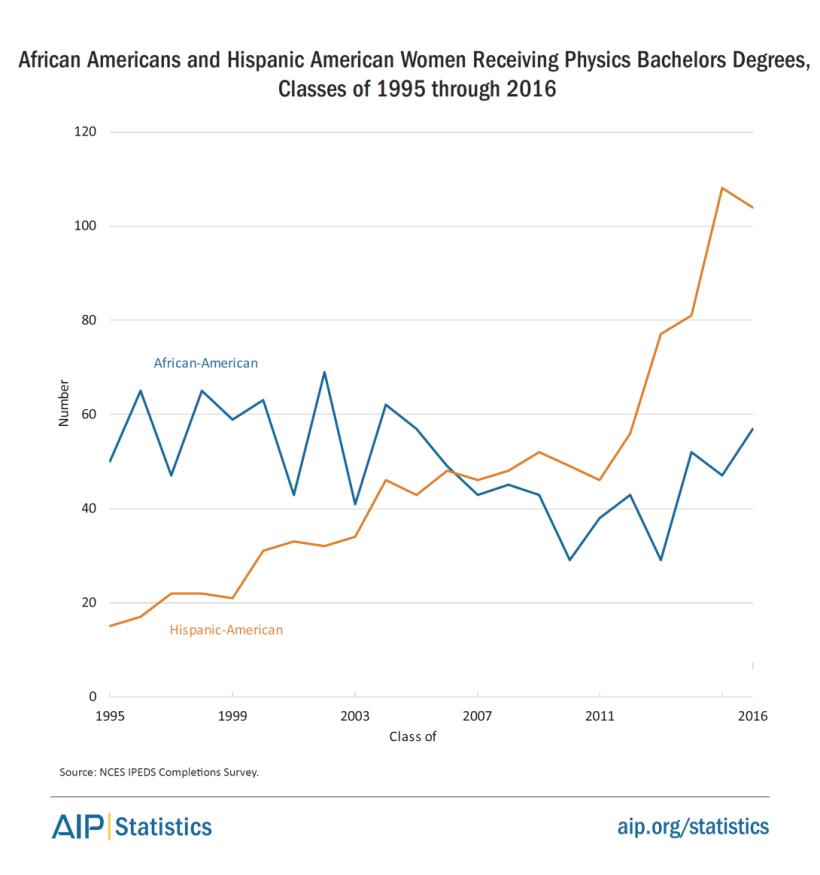
Bachelor’s degrees. In 2016, 7% of women who earned bachelor’s degrees in physics were Hispanic and 4% were African-American (NCES, 2016). In recent years, the number of Hispanic women with physics bachelor’s degrees has doubled, while the number of African-American women generally has not increased (Figure 18).
Figure 18
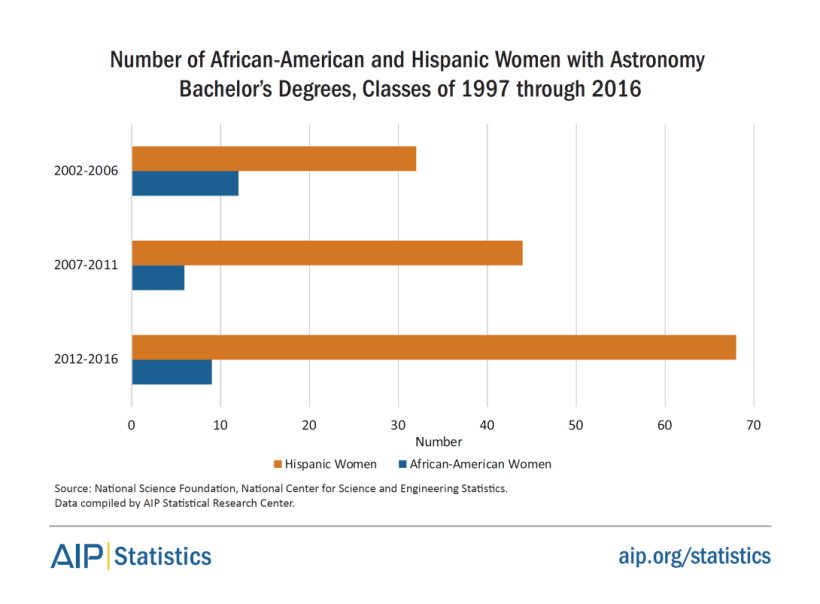
African-American women were also under-represented among astronomy bachelor’s degree recipients; however, Hispanic women were better represented. In 2016, 3% of women who earned astronomy bachelor’s degrees were African-American, and 13% were Hispanic. Since 2002, the number of Hispanic women earning astronomy degrees has doubled (Figure 19). Astronomy graduates were grouped in 4–year intervals to protect individuals from being identified.
Figure 19
There is a limitation to consider when discussing African-American women and their representation among bachelor’s degree recipients. In 2011, NCES began allowing respondents to check multiple races within their survey, and respondents who checked “two or more” races were categorized as “other” rather than African-American, even if one of their choices was African-American. When examining the NCES bachelor’s degree data (Figure 18), there is a slight decrease in the percentage of African-American women after 2011, which might be due to the change in classification. Data on African-American women and bachelor’s degree completion should be interpreted with caution when using NCES survey results.
Doctoral degrees. In 2016, 5% of women who earned physics doctorates were Hispanic, and 3% were African-American (NSF, 2016). In that same year, 4% of women who earned an astronomy doctorate were Hispanic, and 2% were African-American. Due to the small number of Hispanic and African-American women with doctorates, the NSF did make data from previous years available to protect individuals from being identified.
Faculty members. In physics and astronomy departments, African-American and Hispanic women continue to be under-represented among academic faculty members (Figure 20). The 2016 Academic Workforce Survey showed that African-American women were only 2% of all women faculty members in PhD departments, 3% of women faculty members in bachelor’s-only departments, and there were no African-American women in master’s-only departments. Hispanic women were 4% of women faculty members in PhD departments, 3% of women faculty members in bachelor’s-only departments, and 14% of women faculty members in master’s-only departments. The number of Hispanic women in faculty positions is growing over time, but the number of African-American women in faculty positions has shown little or no growth since 2008.
Figure 20

Summary. In physics and astronomy, both African-American and Hispanic women remain under-represented among degree recipients and academic department employees. However, the number of Hispanic women is growing rapidly over time, while the number of African-American women has not grown. Future interventions are needed to find ways that encourage and retain the participation of African-American women in physics and astronomy fields.
Employment
There were over 250,000 jobs in the physical sciences in 2015 (Bureau of Labor Statistics, 2017), and the number of physical science jobs is predicted to grow by 6.7% between 2014 and 2024. As physical science jobs become more available, degree recipients in physics and astronomy are pursuing both academic and non-academic career paths. For example, the 2015 Survey of Doctorate Recipients (NSF, 2015) showed that 39% of physics doctorates work for private businesses and 37% work for four-year academic institutions. Instead of solely focusing on women employed in academia, we wanted to examine career outcomes for women working across all employment sectors, which includes four-year institutions, two-year colleges, K-12 education, government, and private industry.
This section of the report used data from several different surveys. The AIP Follow-up Surveys of Physics Bachelor’s and PhDs contacted physics graduates from the classes of 2015 and 2016 one year after graduation. The 2011 AIP PhD Plus 10 Survey collected data from physics doctorate recipients 10 to 15 years after graduation. The Longitudinal Study of Astronomy Graduate Students, a partnership of AIP and the American Astronomical Society and funded by NSF Award 1347723, collected data from the same group of individuals in 2007–08, 2012–13, and in 2015–16. Lastly, the 2010 Global Survey of Physicists, a partnership of AIP and the Women’s Working Group of the International Union of Pure and Applied Physics, collected data from physicists in over 130 countries.
We analyzed gender differences in salary, job satisfaction, career opportunities, doctoral advisor ratings, and family influences. Linear or logistic regression analyses were used to analyze gender differences. In the analyses, we controlled for several employment factors, so any results are attributable to gender differences and not to other factors. Our models controlled for: age, time since receiving a degree, job sector, full or part-time job status, 9 or 12-month salary schedule, and postdoc completion (doctorate analyses only). In analyses with the data from the 2010 Global Survey of Physicists, we also controlled for each country’s level of development based on classifications from the United Nations.
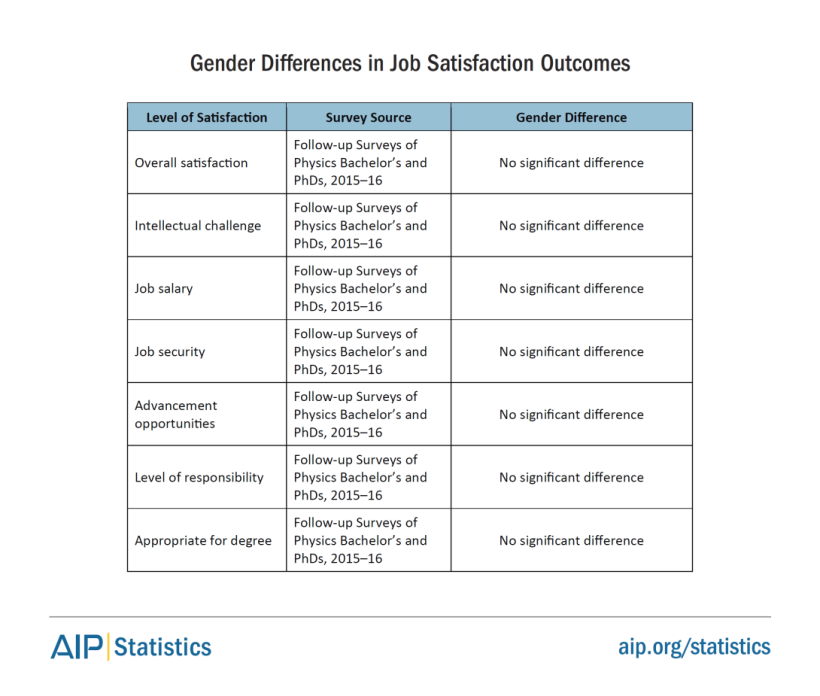
Career satisfaction. According to our Follow-up Surveys of Physics Bachelor’s and PhDs, women and men who graduated in 2015–16 reported similar levels of satisfaction in their current jobs (Table 8). One year after graduating, there were no gender differences in overall job satisfaction, advancement opportunities, job security, level of responsibilities, level of intellectual challenge, and appropriateness of job for their degrees. In conclusion, this suggests that men and women are similarly satisfied with their current jobs immediately after graduation.
Table 8
Salary. We found no evidence of salary differences for men and women one year after graduating with a physics bachelor’s or doctoral degree in 2015–16 (Table 9). This only includes recent graduates who entered the workforce directly and excludes those who went to graduate school or took postdocs. When we looked at doctoral recipients 10 to 15 years after graduation in 2011, we found that men earned 10% more than women, even controlling for other factors that could make a difference in salary. In the 2007–2016 Longitudinal Study of Astronomy Graduate Students, we found no gender differences in salary for astronomy doctoral recipients as of 2015–16.
Table 9

Career opportunities. We examined several indicators of career opportunities and advancement among physics degree recipients including promotions, publications, career activities, and perceived resources (Table 10). In our 2011 PhD Plus 10 Survey, men and women had similar numbers of promotions and publications 10 to 15 years after graduation. However, the time to promotion is longer for women in some circumstances. For example, our 2014 Faculty Member Survey data showed that time to promotion to full professor was one year longer for women (for more information on this analysis, see “The Pipeline” section of this report).
Using data from our 2010 Global Survey of Physicists, we found that men reported engaging in more career advancing opportunities than women, even after accounting for differences in age, employment sector, and the development level of their countries. Men were more likely to present at a conference as an invited speaker, become an editor for an academic journal, become a manager, and supervise graduate students. During their careers, women also perceived that they did not receive enough job resources. Compared to men, women were more likely to report not having enough funding, lab equipment, lab space, and employees.
Table 10

Careers and doctoral advisors. Doctoral advisors can have an important influence on women’s careers after graduation. In a previous study using our 2007–2016 astronomy data, although all graduate students rated their advisors positively overall, women graduate students reported significantly less positive advisor ratings (Figure 21; Ivie, White, & Chu, 2016). In the same study, we found that women who reported more negative doctoral advisor ratings were more likely to leave the astronomy field after graduation than men.
Figure 21

There were similar findings when analyzing data from 2010 Global Survey of Physicists. Although most men and women rated their doctoral advisors positively (either “excellent” or “good”), women graduate students reported significantly less positive advisor ratings (Figure 22). Specifically, more men reported their doctoral advisor as “excellent,” while more women reported their doctoral advisor relationship as “good,” “fair,” or “poor.”
Figure 22

Careers and family. Among physics and astronomy graduates, women’s careers were more impacted by their family lives than men’s (Table 11). Women were more likely to relocate or decline a job offer because of their spouse’s needs, and women were more likely to experience a break in their career for family reasons. Women also made more compromises to balance their career and family life. Women were more likely to choose less demanding schedules, change employers, or become stay-at-home parents.
Table 11

Family influences also impacted women’s career progression. Compared to women without children and to men with or without children, women with children reported slower perceived career progress (Figure 23).
Figure 23

Summary. We found no gender differences in salary or job satisfaction for graduates one year after earning a physics bachelor’s or doctoral degree. However, gender differences emerged when examining mid-career physicists with doctoral degrees. Ten years after earning a physics doctorate, women earned a 10% lower salary than men, which might be due to differences in career opportunities and family influences. As careers progressed, women experienced slower career growth, participated in fewer career advancing opportunities, and reported having fewer job resources. Women were also more likely to make career compromises for family reasons such as limiting their time at work, relocating, or becoming a stay-at-home parent. Gender differences in career opportunities, career resources, and work-life balance seem to limit women from reaching their full career potential.
The Pipeline: Retention of Women between Education to Employment
Across all stages of physics participation included in this report, women’s representation seemingly decreases with each step in the process. In 2013, 46% of women were enrolled in high school physics, but women earned just 21% of physics bachelor’s degrees and 20% of physics doctorate degrees in 2017. In physics departments in 2014, 16% of physics faculty were women and 10% were full-professors. This can appear to be a decrease of 25 percentage points in women’s participation between high school and bachelor’s degree completion, and a decrease of 4 percentage points between women’s doctorate completion and obtaining faculty positions. However, the statistics in this report are from a small window of time (2013–2017), and to properly assess attrition or “leaks” in the pipeline, we must compare recent data with appropriate points in the past. For example, we cannot expect 20% of women to be full professors in recent years if, in the past, women earned a smaller percentage of doctorates.
High school to bachelor’s degrees. In 2013, 46% of high school physics students were young women, and in 2017, women earned 21% of bachelor’s degrees. Although enrolling in high school physics does not necessarily indicate an interest in becoming a physics major in college, the low percentage of physics bachelor’s degrees earned by women indicates a drop-off point for women between high school physics and college graduation. We need more data to understand whether this drop occurs before or during undergraduate education.
Bachelor’s degrees to doctoral programs. Next, we will examine the transition between earning a physics bachelor’s degree and enrolling in a physics doctoral program. Since over 90% of women who earned bachelor’s degrees were US citizens, we only compared women with US citizenship. According to our first-year graduate student survey, most students took no break or a one-year break between undergraduate and graduate education. In the 2016–17 academic year, women with US citizenship earned 20% of bachelor’s degrees in physics. In the Fall of 2017, 21% of first year doctoral students with US citizenship were women. This demonstrates that there are no gender differences in attrition during this transition.
Doctoral program completion. During their doctoral studies, the middle 50% of students took 5–7 years to earn their physics doctoral degrees. Between 2010 and 2012, 20% of first-year graduate students were women, and in 2017, women earned 20% of physics doctorates. Thus, there appears to be no gender differences in attrition during graduate programs.
The analysis on graduate program attrition included women who were US citizens and foreign women. Foreign women accounted for about 50% of the women enrolled in 2010–12 doctoral programs and about 50% of women earning doctoral degrees in 2017. Neither women with US citizenship or women with foreign citizenship showed any attrition during graduate school.
Doctorate degrees to faculty positions. Lastly, we will examine the transition between earning a physics doctorate and becoming a physics professor (Table 12). Based on results from our 2014 Faculty Member Survey, we examined the length of time since doctoral completion for all women who were assistant, associate, and full professors. There was a wide range of graduation years for women who were full professors. The middle 50% of women graduated between 1980 and 1994. During those years, women earned 8% of physics doctorates. Ten percent of full professors in physics department were women in 2014, and thus, women were represented at a higher rate than expected in physics departments.
We found similar trends for associate and assistant professors. The middle 50% of women who were associate professors graduated between 1995 and 2003. During this period women earned 13% of physics doctorates. In 2014, 18% of associate professors in physics departments were women, which was 5 percentage points higher than expected. Finally, we found that the middle 50% of women who were assistant professors graduated between 2005 and 2010, and women earned 17% of doctorate degrees during that time. In 2014, 23% of assistant professors in physics departments were women, which was 6 percentage points higher than expected.
Table 12

Figure 24 compares the actual and expected percentage of men and women at each academic rank in 2014. Based on the percentage of past doctorate completions, there were as many women in full professor positions as expected, and more women in assistant and associate professor positions than expected. This demonstrates that there is no attrition for women between doctorate completion and employment in professorship positions.
Figure 24

So why are women more represented than expected in physics departments? There are several potential explanations for this. First, past research shows that physics departments may be aware of the under-representation of women among faculty members and make efforts to hire more women. In 2003, although 14% of physics doctorates were women, 20% of job offers went to women (National Research Council of the National Academies, 2010). Second, in our 2011 PhD Plus 10 survey data, a significantly greater percentage of men with physics doctorates worked in industry settings compared to women. If more men transition into industry after graduating, this might explain why the representation of women in academia is higher than expected.
Limitations. There is one limitation to our faculty member pipeline analysis. The analysis assumes that men and women take the same amount of time to obtain professorship positions. However, men and women may not advance at the same rate. We conducted a linear regression analysis comparing the years until professorship positions between men and women, controlling for their postdoc experience and the type of academic department (Table 13). There were no gender differences in the time it took to become an assistant or associate professor. However, the time to promotion to full professor for women was, on average, one year longer than for men. This suggests that women may stay at the associate professor level longer than men, and future research should investigate potential explanations for this finding.
Table 13

Attrition in astronomy. In astronomy, we examined women’s transitions between earning bachelor’s degrees, entering graduate school, and doctoral completion. As with physics, most students did not take a break or took a one-year break between their undergraduate and graduate education. In the 2016–17 academic year, women earned 33% of astronomy bachelor’s degrees, and in the Fall of 2017, 40% of first-year astronomy doctoral students were women. It is possible that a greater percentage of students entering astronomy doctoral programs are women, but this comparison is not exact because most astronomy graduate students earn a bachelor’s degree outside astronomy. Based on our 2015–16 Follow-up Survey of Astronomy PhDs, around 60% of women in astronomy graduate programs received their bachelor’s degree in other STEM majors. Therefore, comparisons made between the percent of bachelor’s recipients and graduate students in astronomy should be interpreted with caution.
In astronomy graduate programs, the middle 50% of students took 6–7 years to graduate. In 2010–12, 37% of first year graduate students were women, and women earned 40% of doctoral degrees in 2017. This suggests that, proportionally, more women completed graduate school in astronomy than men.
We do not have the data to perform pipeline analyses for astronomy at the faculty member level. Therefore, we are unable to examine the expected proportion of astronomy faculty who are women based on past degree completions.
Summary. In conclusion, there is no evidence of attrition for women in physics and astronomy between undergraduate degree completion, graduate degree completion, and obtaining faculty positions. Furthermore, women are more represented in associate and assistant professor positions in physics than expected. Women may decrease their participation in physics between high school and completing their undergraduate degrees, but more data is needed to understand this transition.
Conclusions
The participation of women in physics and astronomy has grown substantially over the last few decades, but the representation of women in physics and astronomy is still low compared to other academic fields. Although women receive over 50% of academic degrees (NCES, 2016), women earned only 21% of physics bachelor’s degrees and 20% of physics doctorates in 2017. The representation of women in astronomy is still higher than physics. In 2017, women earned 33% of astronomy bachelors’ degrees and 40% of astronomy doctorates. In the last decade, the percentage of women earning doctoral degrees in physics and astronomy has continued to grow, while the percentage of women earning bachelor’s degrees has changed very little.
Fortunately, the percentage of women represented in physics remains consistent between completing undergraduate education and obtaining faculty employment, which indicates that there are no gender differences in attrition between these academic stages. Based on our pipeline analysis, the percentage of women employed in physics faculty positions matches the percentage of women who received physics doctorates in the past. If this pattern continues, we predict that the representation of women among physics and astronomy faculty should increase over time now that more women are receiving physics doctorates in recent years. Women may still experience more attrition than men between high school physics enrollment and bachelor’s degree completion; however, more data is needed to determine whether this attrition occurs before or during undergraduate education.
When we examined employment outcomes of women with physics and astronomy degrees, we found several gender differences in mid-career employment. In early stages of physics careers, men and women have similar salaries and levels of job satisfaction. However, in later stages of physics careers, men receive a 10% higher salary than women, and women report having fewer career resources and career opportunities. In addition, women with children report slower career progression and make more career compromises for family reasons (e.g. relocating, working fewer hours, leaving their jobs). The challenges women experience with career resources, opportunities, and family responsibilities seem to negatively impact their career potential.
Lower representation and participation of women, minorities, and other groups in education and employment can impact progress in physics and astronomy fields. Research suggests that diverse teams can lead to increased creativity and productivity (Smith-Doerr, Alegria, & Sacco, 2017) because there can be more exchanges of unique ideas and experiences and increased access to diverse social networks for information gathering and dissemination. Therefore, physics and astronomy should continue to encourage the representation and participation of women and other groups who can offer unique and diverse perspectives within the scientific community.
References
Bureau of Labor Statistics (2017). STEM occupations: Past, present, and future. Retrieved from https://www.bls.gov/oes/publications.htm
The College Board (2017). Program Summary Report 2017. Retrieved from https://research.collegeboard.org/programs/ap/data/archived/ap-2017
Ivie, R., White, S., & Chu, R. (2016). Women’s and men’s career choices in astronomy and astrophysics. Physical Review of Education Research, 12, 1-9.
National Center for Education Statistics (2016). Digest of education statistics: 2016. Retrieved from https://nces.ed.gov/ipeds/
National Research Council (2010). Gender differences at critical transitions in the careers of science, engineering, and mathematics faculty. Washington, DC: The National Academies Press. https://doi.org/10.17226/12062
National Science Foundation (2015). Survey of doctorate recipients, 2015. Retrieved from https://www.nsf.gov/statistics/srvydoctoratework/#tabs-2
National Science Foundation (2016). Doctorate recipients from U.S. universities: 2016. Retrieved from https://www.nsf.gov/statistics/srvydoctorates
Smith-Doerr, L., Alegria, S., & Sacco, T. (2017). How diversity matters in the UD Science and Engineering Workforce: A critical review considering integration in teams, fields, and organizational contexts. Engaging Science, Technology, and Society, 3, 139-153. DOI: 10.17351/ests2017.142
United States Census Bureau (2010). Overview of race and Hispanic origin 2010. Retrieved from http://www.census.gov/programs-surveys/decennial-census/data/datasets.20...
White, S. & Ivie, R. (2013). Number of Women in Physics Departments: A Simulation Analysis. Retrieved from https://www.aip.org/statistics/reports/number-women-physics-departments-...
White, S., & Tesfaye, C.L. (2014). High school physics courses and enrollments. Retrieved from https://www.aip.org/statistics/reports/high-school-physics-courses-enrol...
e-Updates
You can sign up to receive e-mail alerts which notify you when we post a new report. Visit www.aip.org/statistics/e_updates
Follow us on Twitter
The Statistical Research Center is your source for data on education and employment in physics, astronomy, and other physical sciences. Follow us at @AIPStatistics


