The State of the Academic Workforce in Physics and Astronomy, 2000-2024


Report Highlights
- From 2022 to 2024, the overall number of faculty members remained stable in physics and astronomy departments.
- The number of faculty members in physics departments granting PhDs showed a 4% increase from 2022 to 2024, while the total number of faculty members in physics departments granting only bachelor’s degrees showed a 7% decrease from 2022 to 2024.
- The percentage of nontenured positions in physics departments (21%) remained stable from 2022 to 2024; the percentage of nontenured positions in astronomy departments (33%) increased by 4% from 2022 to 2024.
- There was more turnover among faculty members in 2024. For example, there was a 7% increase in faculty departures at physics departments between the academic years of 2020-21 and 2022-23, and a 33% increase in faculty new hires at physics departments between the academic years of 2021-22 and 2023-24.
- The overall percentage of women among faculty members in physics departments (21%) and astronomy departments (25%) continued to increase in 2024. Since 2014, the percentage of women has increased by 5% in physics departments and 6% in astronomy departments.
- In astronomy departments, a smaller percentage of women were among faculty new hires in 2024 (34%) compared to 2022 (38%).
About the Academic Workforce Survey
Every two years since 2000, the American Institute of Physics has surveyed all degree-granting physics and astronomy departments across the United States (Table 1) to conduct a national census on the number of currently employed faculty members. The results of this survey provide valuable metrics on the health of the physics and astronomy workforce, including data on faculty member tenure status and academic rank, as well as the number of faculty member departures, retirements, and new hires. This report provides data from the latest round of the survey conducted in the spring of 2024. As a result, the current data will not show trends related to federal policy changes in 2025, which as preliminary data from departments suggests, may have effects on student enrollment and faculty employment (White, Owens, & Mulvey, 2025 ). We will have more information on these effects when the next survey round is conducted in the spring of 2026.
Report definitions:
- Faculty member: Any position in the department that involves teaching or research in physics or astronomy. This does not include graduate students or postdocs.
- Full-time equivalent (FTE): A system for counting faculty positions by full-time status in a department. A full-time faculty member is counted as 1, while a part-time faculty member is counted as less than 1 (for example, 0.5), depending on the amount of work they perform in a department.
- Physics department: Any university or college department in the United States that awarded a physics bachelor’s, master’s, or doctoral degree as of the 2023-24 academic year. This includes any departments that jointly award both a physics and astronomy degree.
- Astronomy department: Any university or college department in the United States that awarded an astronomy bachelor’s, master’s, or doctoral degree as of the 2023-24 academic year and does not also award a physics degree.
Table 1


Total Number of Full-Time Equivalent Faculty Members in Physics and Astronomy Departments
Tables 2 and 3 show the estimated total and average number of faculty members employed in physics departments over time, displayed by department type (whether a department awarded a PhD, master’s, or bachelor’s as their highest degree). In the spring of 2024, there was an estimated total number of 10,160 faculty members in physics departments.
At PhD-granting physics departments, the total estimated number of faculty members has increased by 4% from 2022 to 2024. At physics departments where a bachelor’s degree was the highest degree awarded, the total estimated number of faculty members has decreased by 7% from 2022 to 2024. The number of departments granting these bachelor’s degrees has also decreased from 2022 and 2024, which may provide a partial explanation for the decrease in faculty members. Similar trends are shown for physics departments where a master’s degree was the highest degree awarded.
Table 2


Table 3


Table 4 shows the estimated number of faculty members employed in astronomy departments. In the spring of 2024, there were 800 total estimated faculty members in astronomy. While there was a decrease in the number of astronomy departments granting degrees from 2022 to 2024, there was also an increase in the average number of faculty members per astronomy department.
Table 4


Tenure Status and Academic Rank of Full-Time Equivalent Faculty Members in Physics and Astronomy Departments
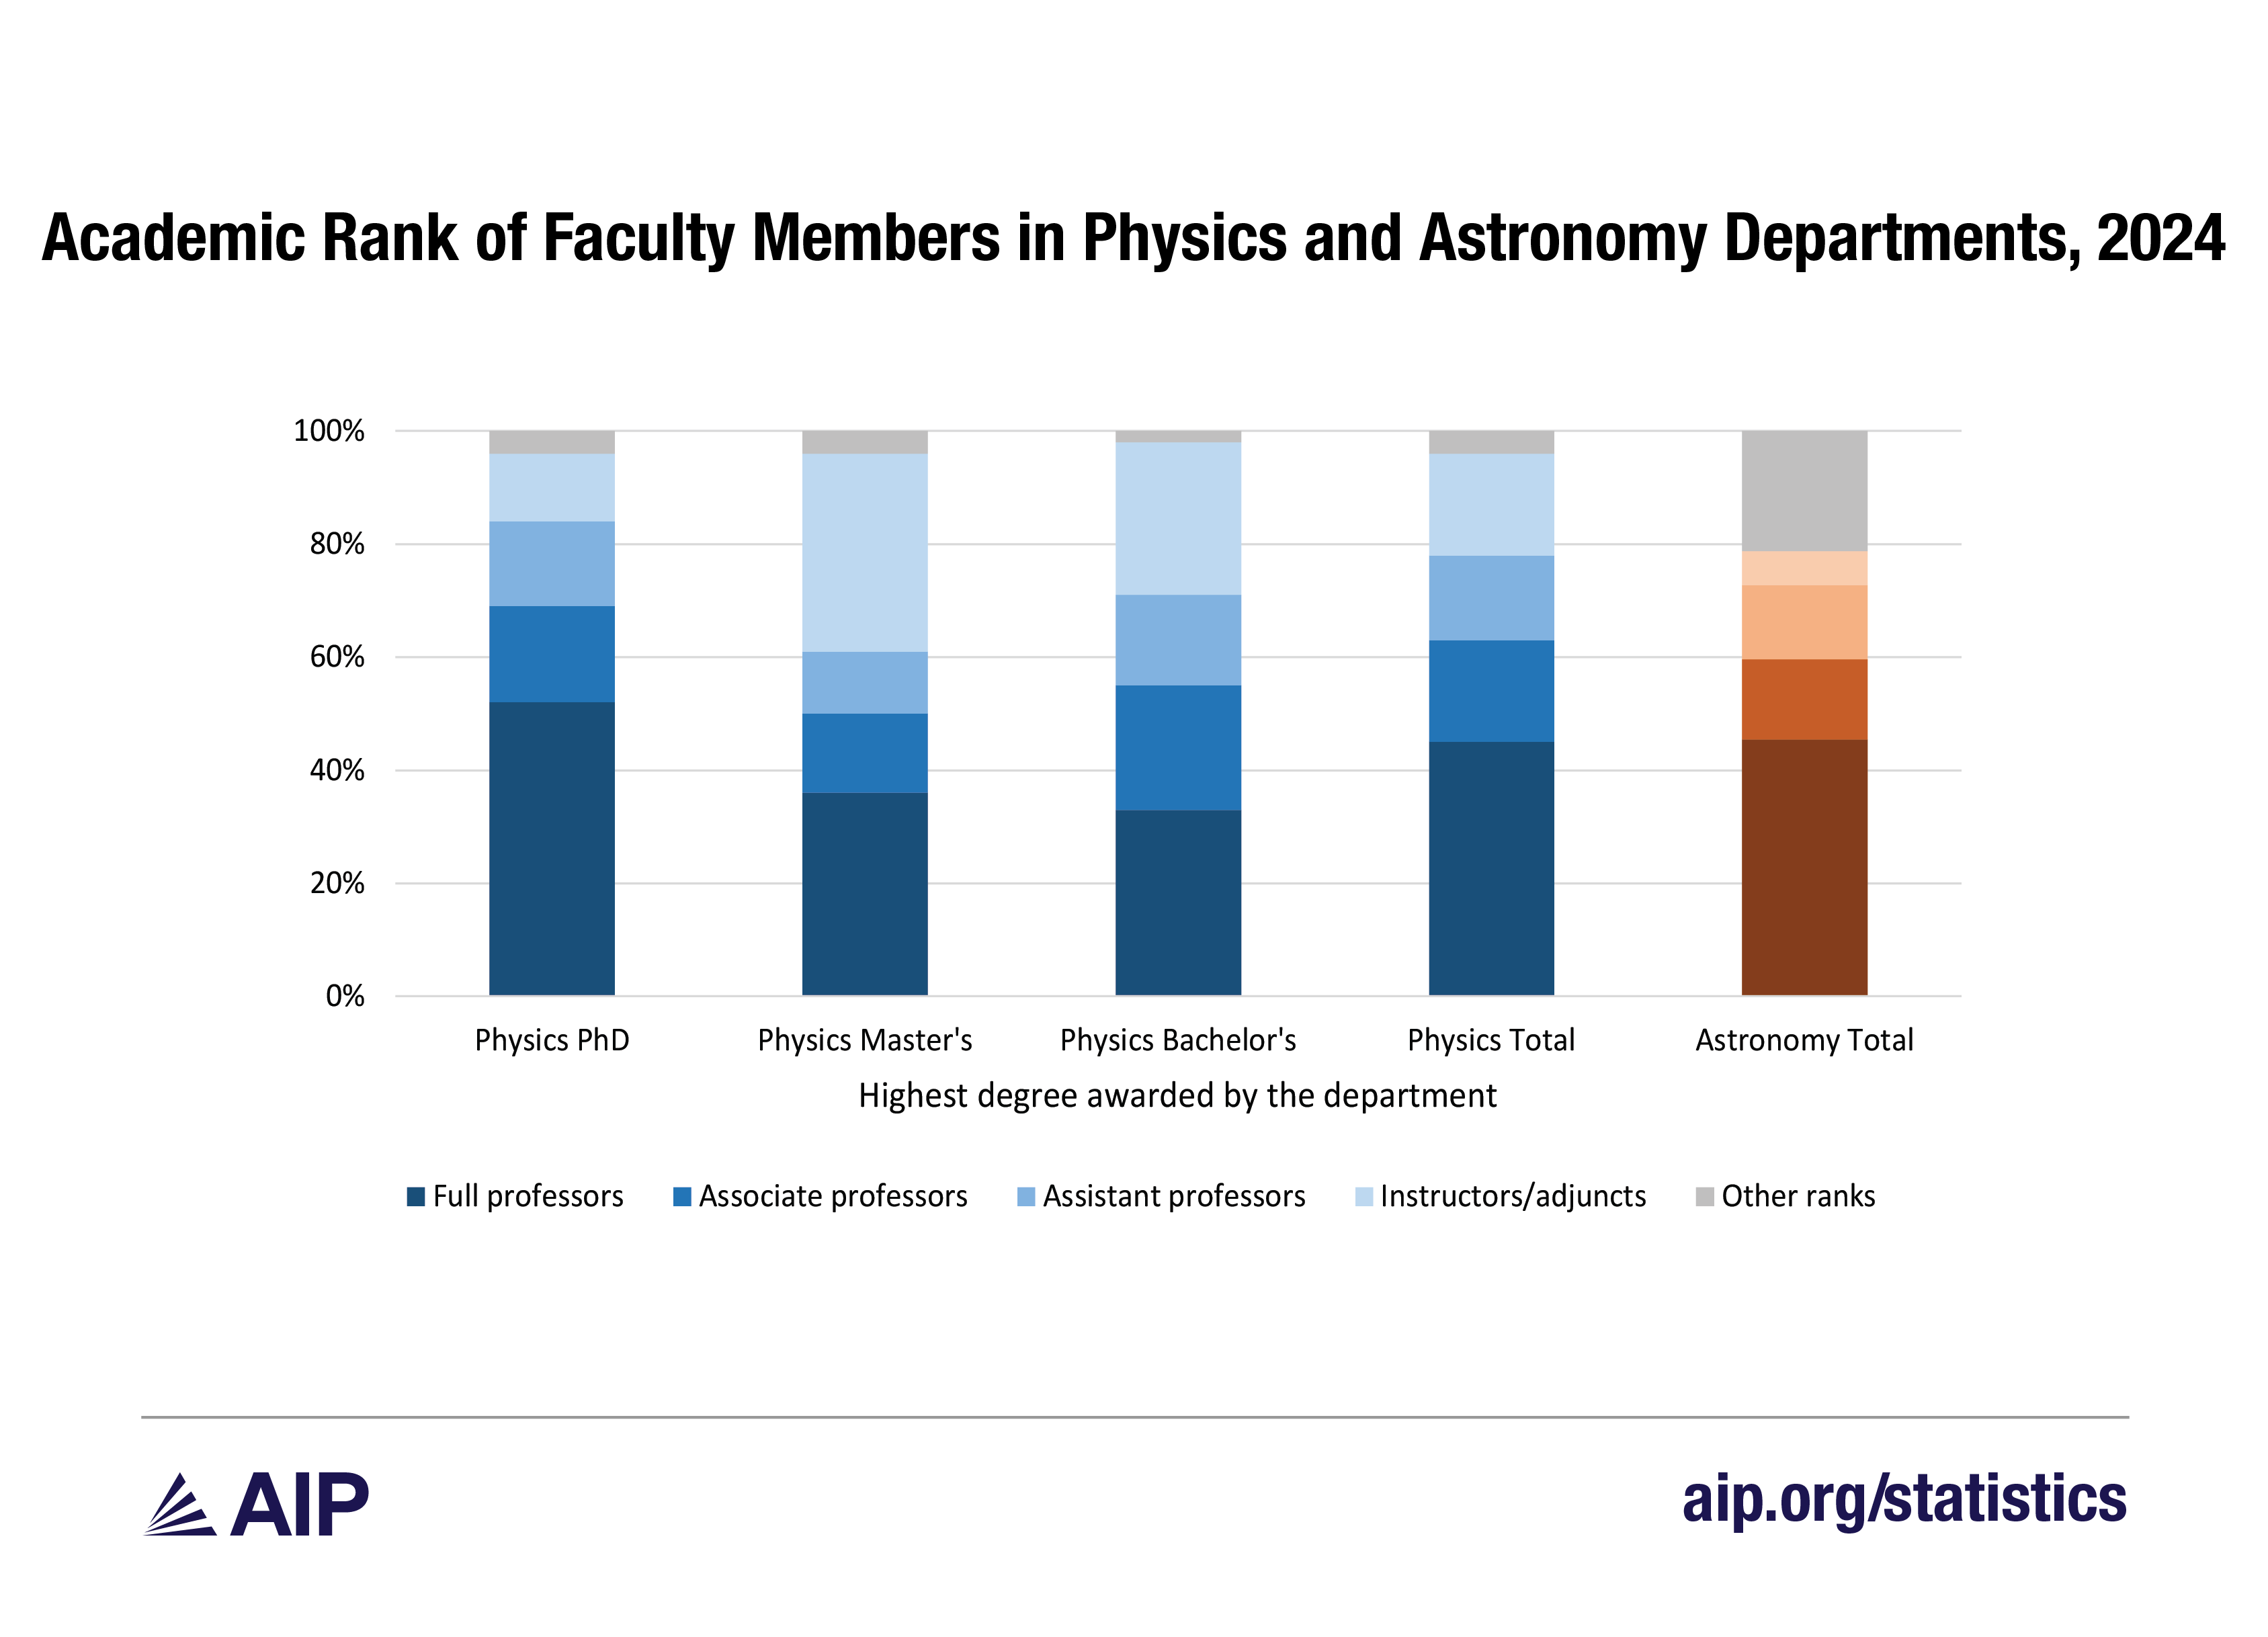
Table 5 and Table 6 below show the tenure status and academic rank of faculty members in physics and astronomy departments in the spring of 2024. Most faculty members in departments were tenured and full professors.
Table 5


Table 6


Figure 1 and Figure 2 below show the percentage of nontenured positions in departments over time. Overall, the percentage of nontenured positions in physics departments has remained stable since 2014, although we do see a notable increase in nontenured positions at physics departments that awarded a master’s as their highest degree.
Figure 1


The percentage of nontenured positions in astronomy departments has increased by 4% from 2022 to 2024. When we looked at the academic ranks of new, nontenured astronomy hires, departments reported hiring research professors and visiting professors.
Figure 2


Figure 3 and Figure 4 show the tenure status and academic rank of faculty members by physics department type in the spring of 2024. PhD-granting departments employed a greater percentage of tenured positions and full professors.
Figure 3

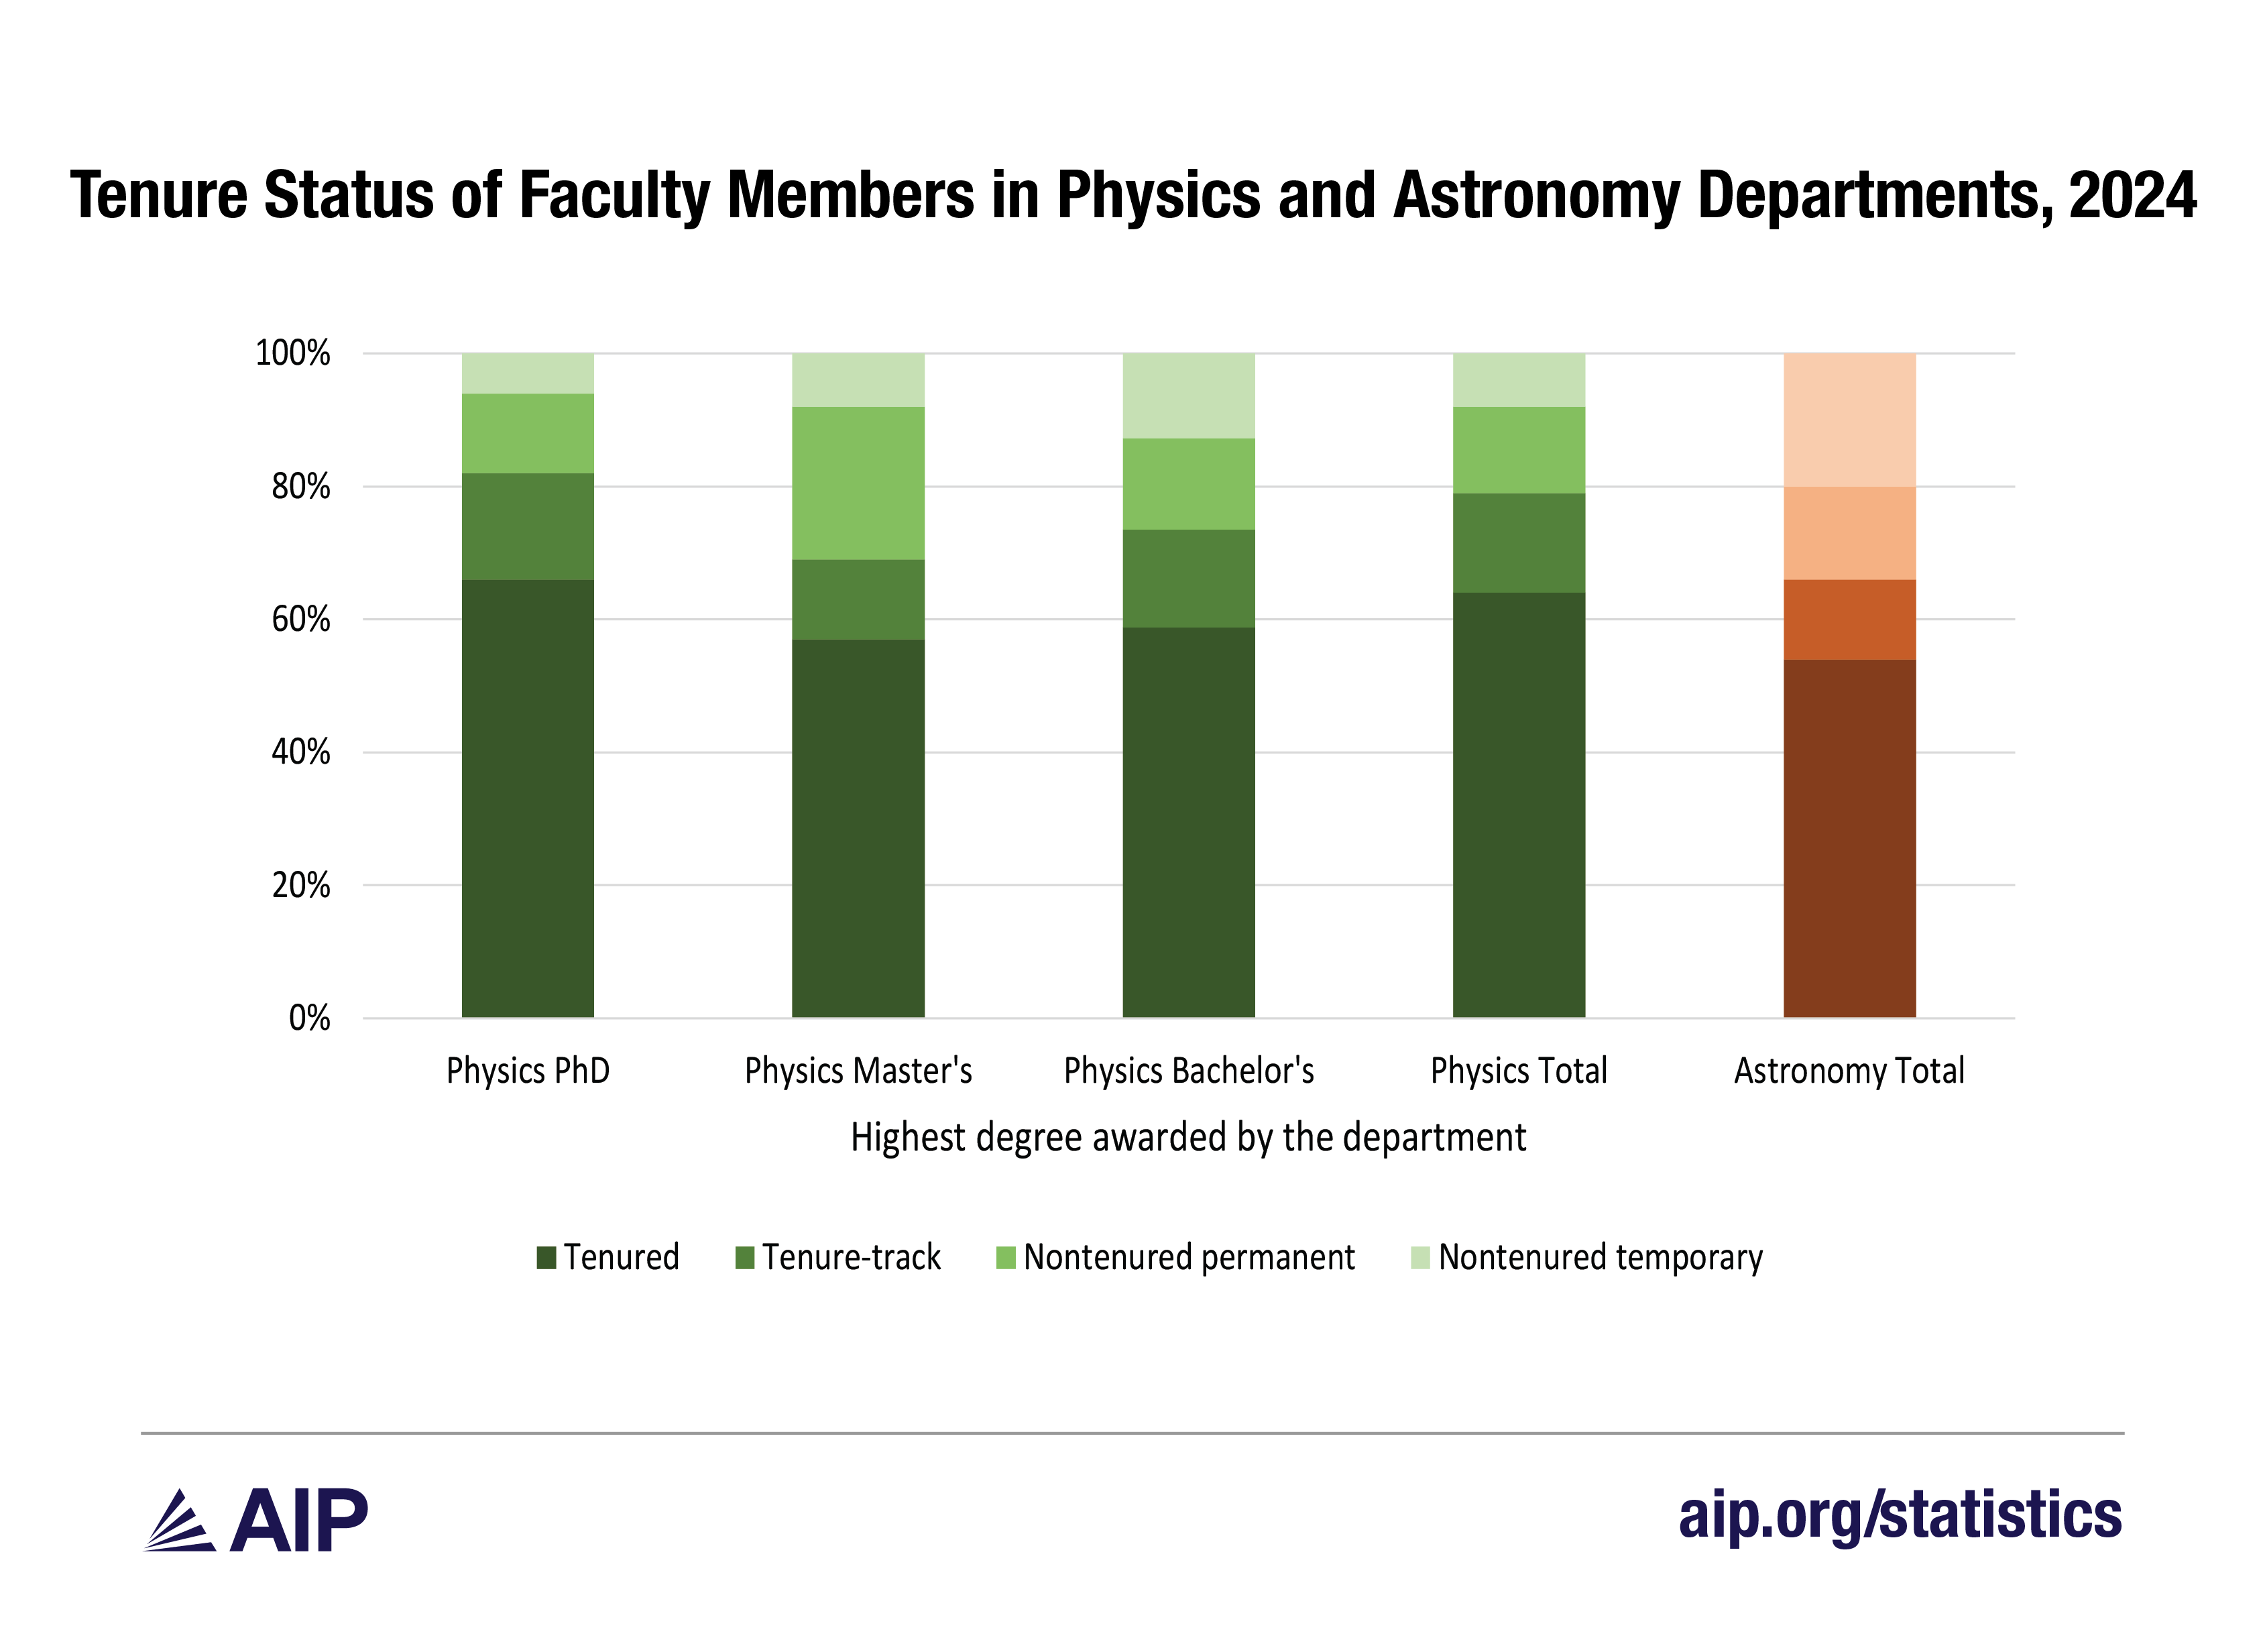
Figure 4

Women Employed at Physics and Astronomy Departments
Table 7 and Figure 5 below show the percentage of women employed in physics departments over time by academic rank. Total numbers are in head counts, not by full-time equivalent (FTE) status. The steady increase in the percentage of women among faculty members in physics departments is readily apparent in Figure 5.
Table 7


Figure 5


Table 8 and Figure 6 below show the percentage of women employed in astronomy departments over time by academic rank. The proportion of women in astronomy departments is higher than in physics departments. From 2022 to 2024, the percentage of women in departments has increased among “other” ranks and “associate professor” ranks.
Table 8


Figure 6


Table 9 shows the percentage of women among new hires at physics and astronomy departments for the 2023-24 academic year. From 2022 to 2024, there was a 3% decrease for women among new hires in physics departments and a 4% decrease for women among new hires in astronomy departments. In both disciplines, the percentage of women among new hires in 2023-24 was still higher than the percentage of women among all faculty members, indicating that the number of women in departments will continue to increase in the future.
Table 9


New Hires Among Physics and Astronomy Faculty Members
For the 2023-24 academic year, physics departments hired 611 new faculty members and astronomy departments hired 42 new faculty members (Table 10). As shown in Figure 7 and Figure 8, there was a decrease in faculty hiring in 2021-22, however; the number of new hires greatly increased in 2023-24, at even higher numbers than six years ago. The same pattern can be seen for new hires in astronomy departments.
Table 10


Figure 7


Figure 8


Figure 9 and Figure 10 show the tenure status and academic rank of new faculty members hired for the 2023-24 academic year. Most new hires were employed in tenure-track positions as assistant professors. Departments that awarded a physics bachelor’s or master’s as their highest degree hired a greater percentage of nontenured faculty positions.
Figure 9


Figure 10


Tables 11, 12, and 13 show the background of new faculty hires at physics departments for the 2023-24 academic year. There were too few new hires at astronomy departments and physics departments that awarded a master’s as their highest degree to show any breakdowns in new faculty backgrounds.
New hires were more frequently hired from postdocs or nontenured faculty positions (Table 11). PhD-granting physics departments more frequently hired faculty members after postdocs, while bachelor’s departments more frequently hired faculty members after working in nontenured positions.
Table 11


Most new faculty members came from another academic department in the United States (Table 12), and only 10% of new faculty members previously worked for an employer outside of the United States.
Table 12


Almost half of physics and astronomy department new hires earned their PhD recently within the last five years, and most earned their PhD in the United States (Table 13).
Table 13


Departures and Retirements of Faculty Members in Physics and Astronomy Departments
In the spring of 2024, we asked how many departures each department had during the previous academic year of 2022-23. Physics departments had a total of 425 departures and astronomy departments had a total of 28 departures in 2022-23 (Table 14). A departure included a faculty member leaving a department due to retirement, passing away, or transferring to another position elsewhere. About half of all departures were due to retirements in physics departments, and more than two-thirds of departures were due to retirements in astronomy departments.
Table 14


There was an increase in the number of retirements and departures in physics departments from 2020-21 to 2022-23 (Figure 11 and Figure 12). However, as shown earlier, there was also an increase in new faculty hires in 2023-24, showing greater turnover overall.
Figure 11


Figure 12


Astronomy departments also experienced an increase in retirements from 2020-21 to 2022-23 (Figure 13 and Figure 14). Like in physics departments, astronomy departments have seen an increase in new hires simultaneously from 2021-22 to 2023-24.
Figure 13


Figure 14


Survey Methodology
The Academic Workforce Survey is conducted every two years, and the most recent round of the survey was distributed in the spring of 2024. Table 15 below shows the response rates for the survey. Online surveys were completed by department chairs or administrators. The overall response rate was 82% for physics departments and 89% for astronomy departments. Data from a selection of nonresponding large physics departments was manually entered using faculty searches from public websites. In addition, all results except the new hire demographics were estimated using sample weights to account for nonrespondents.
Table 15


References
White, S., Owens, T., & Mulvey, P. (2025). Impacts of restrictions on federal grant funding in physics and astronomy graduate programs. Retrieved at https://www.aip.org/statistics/impacts-of-restrictions-on-federal-grant-funding-in-physics-and-astronomy-graduate-programs


